Statistics Canada uses the Ivision Beyond 20/20 Browser on many of its database products. This viewer provides pivoting spreadsheets, graphing, and exporting capabilities which allow users enhanced on-screen tailoring of data.
Contents
Access Data
- From the University of Waterloo Library page https://lib.uwaterloo.ca/ under books, articles, etc., select E-Data and then select TUG Data Resources. This will contect you to the TDR TriUniversity Data Resources page (http://tdr.tug-libraries.on.ca/).
- Data sets such as those available for the Canadian Census are published in the Beyond 20/20 format and will require this program, which is free to download.
Using Beyond 20/20
When you access data that uses Beyond 20/20, you may need to temporarily allow pop-ups.
Definitions
- To view notes on dimension or item - double click on highlighted, underlined items to view information.
Dimension - An aspect of the data (i.e., region or sex), which is broken down into one or more items (i.e., Canada and Ontario, or male and female).
Item - An element of a dimension. An item can be identified by its unique code. It may have one or more labels assigned to it.
Codes: 1996 - Code numbers can be found in Standard Geographical Classification CA1SC 12-571 1996 UW Porter Gov. Pubs. Quick Ref.
Dimensions
- To move or switch the column and row dimensions of a table - click and drag the row or column and drop it on the new location. (Click here to see a screenshot)

- To scroll through dimensions - click and highlight dimensions on table or click down arrow button beside the dimension window
 and select dimension required.
- To change column widths - move mouse over column line you want to change and when a double line appears
 click and drag column line to desired width. For the dimension across the top of the table this has to be done at the right side of the first cell.
- To change orientation of table with 3 or more dimensions - with the left mouse button depressed, drag the dimension not already occupying a row or column to the edge of another dimension until a thick line or highlight appears, then release the mouse button. This can be done vertically or horizontally.
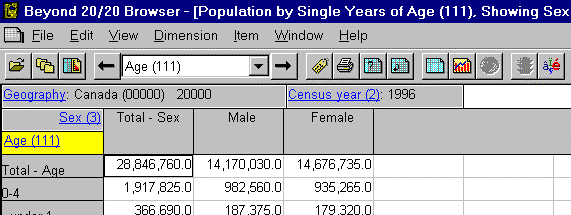
Below is a table of the population by single years of age as shown in the Beyond 20/20 browser.

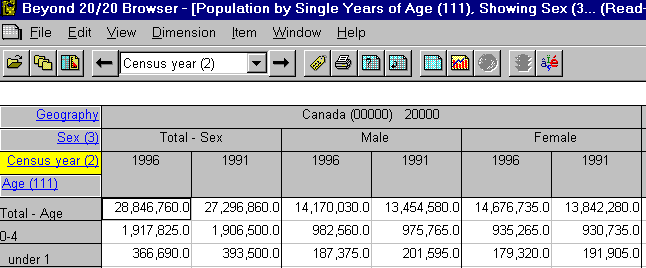
Population by sex, but also with year of census shown in the Beyond 20/20 Browser below.

 To change the way the dimension is sorted - click (highlight) the dimension you want to work with, then click on Dimension and select Sort or click on the Sort button. Click on Sort Options: you want and click on OK.
 To change how the Geography dimension is viewed - if you have a geography number and want to view the dimension by number, click (highlight) Geography dimension, then click on Dimension and select Change Labels or click on Label button . Keep doing until dimension is listed how you want or has returned to the beginning of the list.
Searching for Data
 To find data within a dimension - click (highlight) dimension in which you want to find something. Click on Dimension and select Search or click on Search button. A dialogue box will appear, click on Field you want to search and then type what you want to find in dialogue box. Click on OK.
- To list data around items found - click on Dimension and select Show All. The data you had searched for will be near the bottom of the screen.
- To return to how dimension was listed - click on Dimension and select Reset.
Selecting Data
- To select a row or column - click on the corresponding row or column heading.
- To select adjacent rows or columns - drag the mouse across the row or column headings.
- To select non-adjacent rows and/or columns - press the <Ctrl> key down and click on the row and/or columns.
- To display only the selected data - click on Item and select Show.
- To hide data selected - click on Item and select Hide.
- To return to how dimension was listed - click on Dimension and select Reset.
Charting
- Select the rows and/or columns that you want to chart.
 Click on View, select Chart or click on Chart button
- Once a chart is opened to change the chart type, click on View, select Chart Options or right click on chart and select Chart Options. Pick chart type and click on OK.
 To create a series of charts in succession - click on one of the headings in the title of the chart to make that dimension active. Use the Previous Item and Next Item buttons to chart new items.
 To close the chart and return to the table click on the X in the upper right corner of the chart.
Printing
- Click on File, select Print or click on Print button
 .
.
- On designated networked printing computers within the Library, a Print dialogue box will open, click OK.
- Then the Print Job ID dialogue will appear. In the User Name box, enter your own name (or nickname). Click on PrintIt.
- Go to the Job Release Workstation to release the print job.
Exporting/Saving Data
- Select items from the table by pressing <Ctrl> key and left mouse button.
- Click on File, select Save As. Specify File Name, then navigate to the Directory and Drive where you want to save the data. Under List Files of Type select WKS worksheet(*.wks) or WK1 Worksheet(*.wk1) to save as a spreadsheet i.e., Excel. Select dBase File(*.dbf) if data will be used in ArcView desktop mapping.
Ann Naese
Revised May 24, 2000
For assistance enquire at the UMD Library Public Service Desk or or consult the Ask a Librarian Web page at: https://lib.uwaterloo.ca/asklib/
Library Guide, No. 7.6 Using Beyond 20/20 on the Web
https://lib.uwaterloo.ca/libguides/7-6/index.html
Copyright © University of Waterloo
Liaison Librarian (University Map and Design Library)
Richard Pinnell (rhpinnel@library.uwaterloo.ca)
Last Updated:
March 30, 2011


